


Configure Monitoring
This guide explains how to use the Monitoring interface to enable and configure Prometheus-based monitoring for your database. You can choose from three monitoring methods and optionally customize the metrics exporter sidecar that is injected alongside your database.
1. Getting Started
To begin, select Monitoring from the left sidebar.
You will land on the Monitoring form, which is divided into the following sections:
- Enable Monitoring — Master toggle to turn monitoring on or off.
- Select a Monitoring Method — Choose how Prometheus scrapes your database metrics.
- Exporter Configuration — Optionally customize the metrics exporter sidecar container.
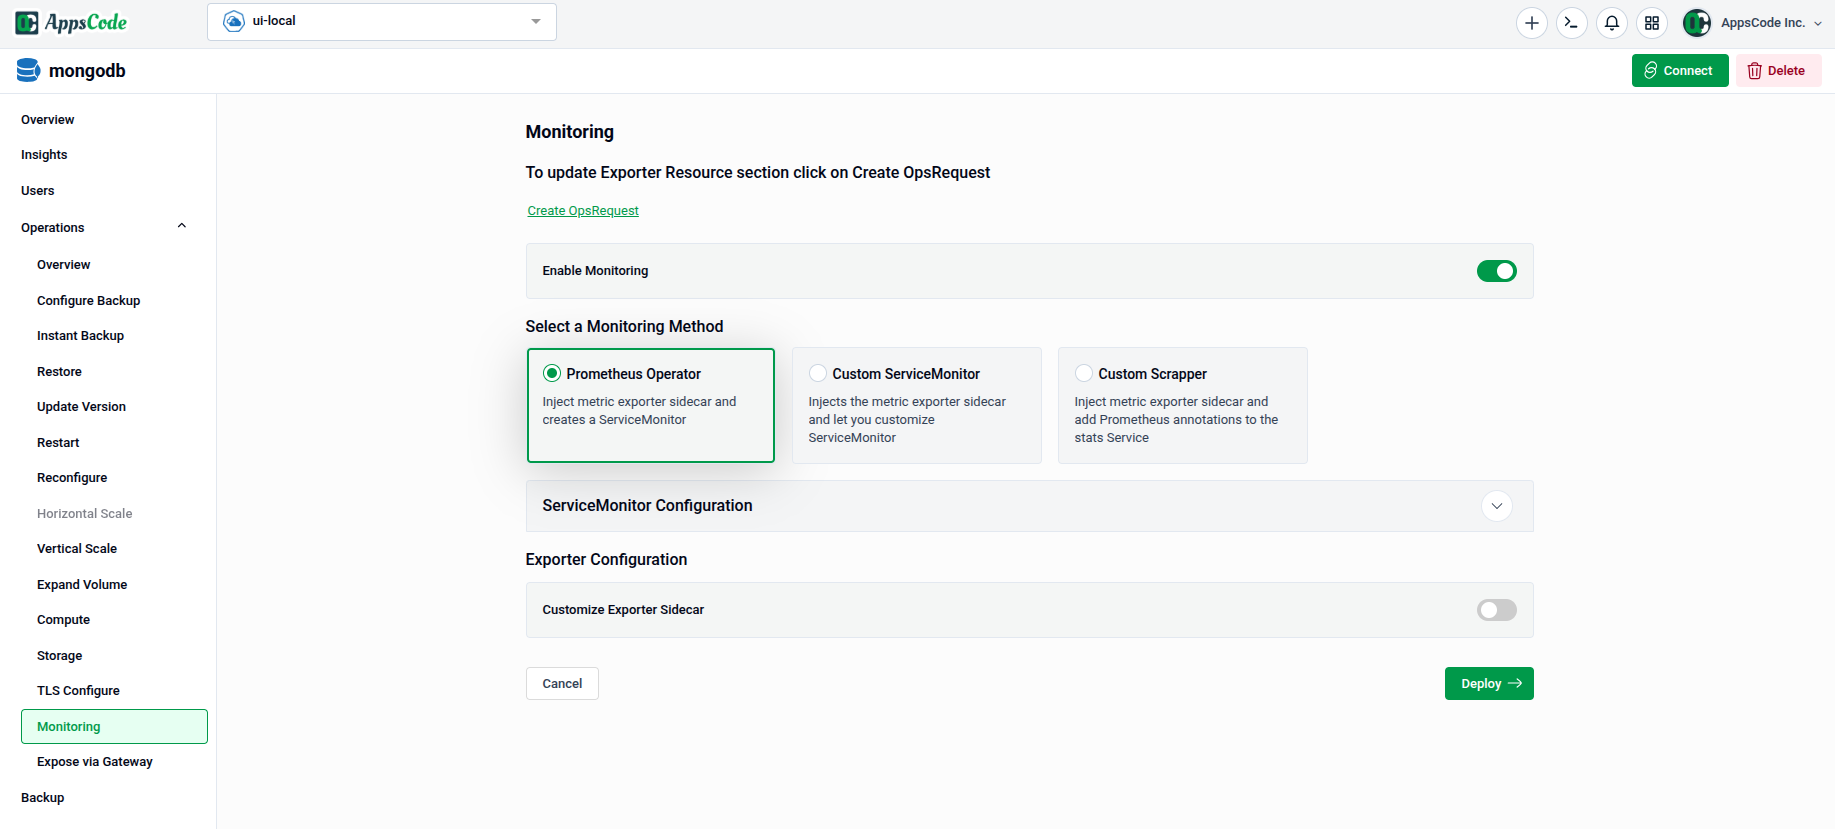
Note: To update the Exporter Resource section, click on Create OpsRequest at the top of the page.
2. Enabling Monitoring
Toggle Enable Monitoring to the on position to activate the monitoring configuration for your database. When disabled, all monitoring settings below are inactive.
3. Selecting a Monitoring Method
Three monitoring methods are available. Select the one that fits your Prometheus setup.
3.1 - Prometheus Operator
Prometheus Operator injects a metrics exporter sidecar into your database pod and automatically creates a ServiceMonitor resource that Prometheus Operator picks up for scraping.
Selecting this method expands the ServiceMonitor Configuration panel:
- Scrapping Interval: How frequently Prometheus scrapes metrics from the database (e.g.,
30s). Defaults to30sif left unchanged.
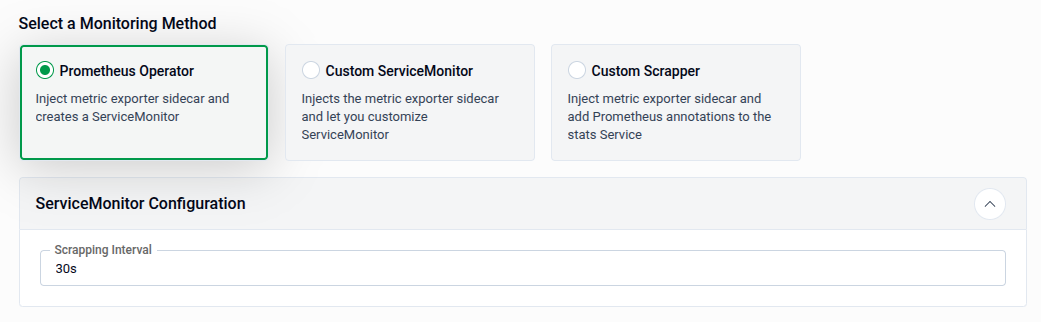
Tip: Use Prometheus Operator if you already have the Prometheus Operator installed in your cluster — it handles
ServiceMonitorcreation automatically.
3.2 - Custom ServiceMonitor
Custom ServiceMonitor injects the metrics exporter sidecar but lets you fully customize the ServiceMonitor resource rather than using the auto-generated one.
Selecting this method expands an Endpoints panel and a Labels panel for fine-grained control:
| Field | Description |
|---|---|
| Honor Labels | Toggle to preserve labels from the scraped target when there are conflicts. |
| Interval | Scraping interval for this endpoint (e.g., 30s). |
| Path | The HTTP path to scrape metrics from (e.g., /metrics). |
| Port | The port name or number to scrape. |
Use + Add new in the Labels panel to attach additional key-value labels to the ServiceMonitor. You can also add multiple endpoints using + Add new button in Endpoints panel.
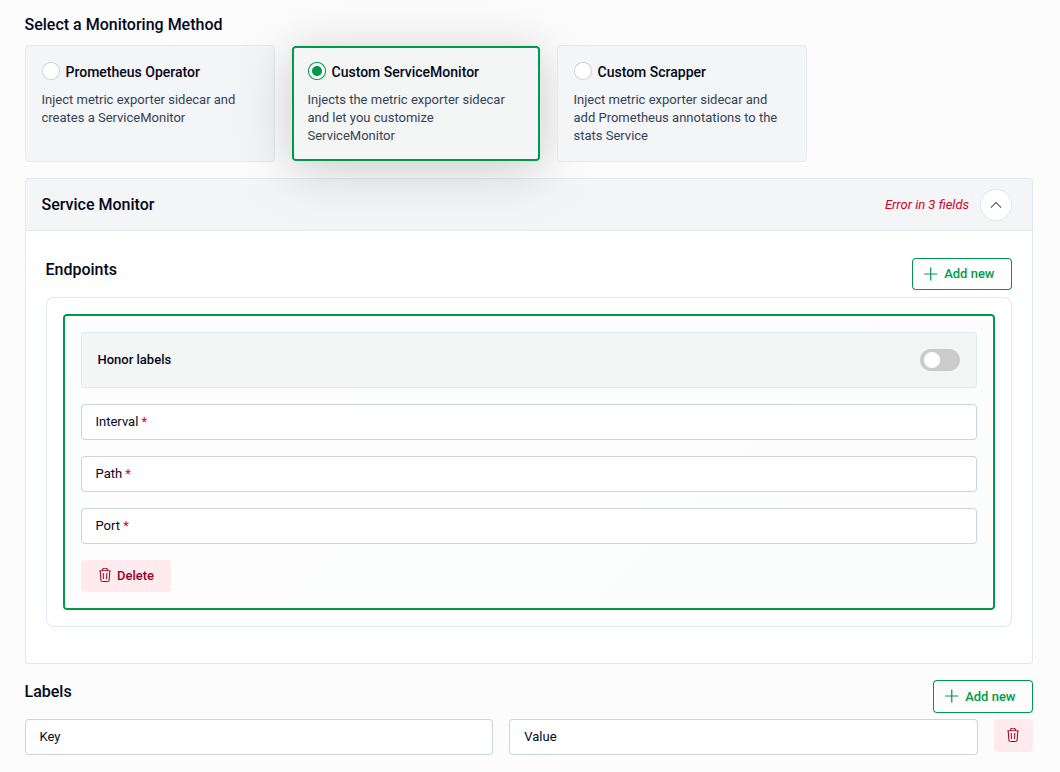
Note:
Interval,PathandPortfields are mandatory in Endpoints section.
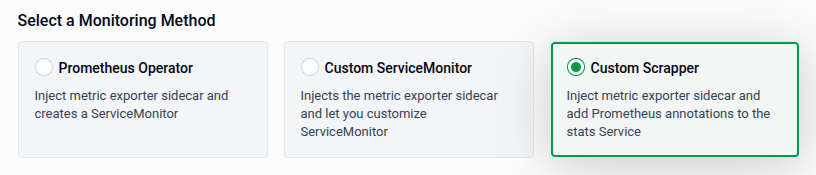
3.3 - Custom Scrapper
Custom Scrapper injects the metrics exporter sidecar and adds Prometheus scraping annotations directly to the stats Service, instead of creating a ServiceMonitor. Use this method with setups that rely on annotation-based service discovery rather than the Prometheus Operator.
4. Configuring the Exporter Sidecar
The Exporter Configuration section allows you to customize the metrics exporter sidecar container that is injected into your database pod. Toggle Customize Exporter Sidecar to expand the configuration options.
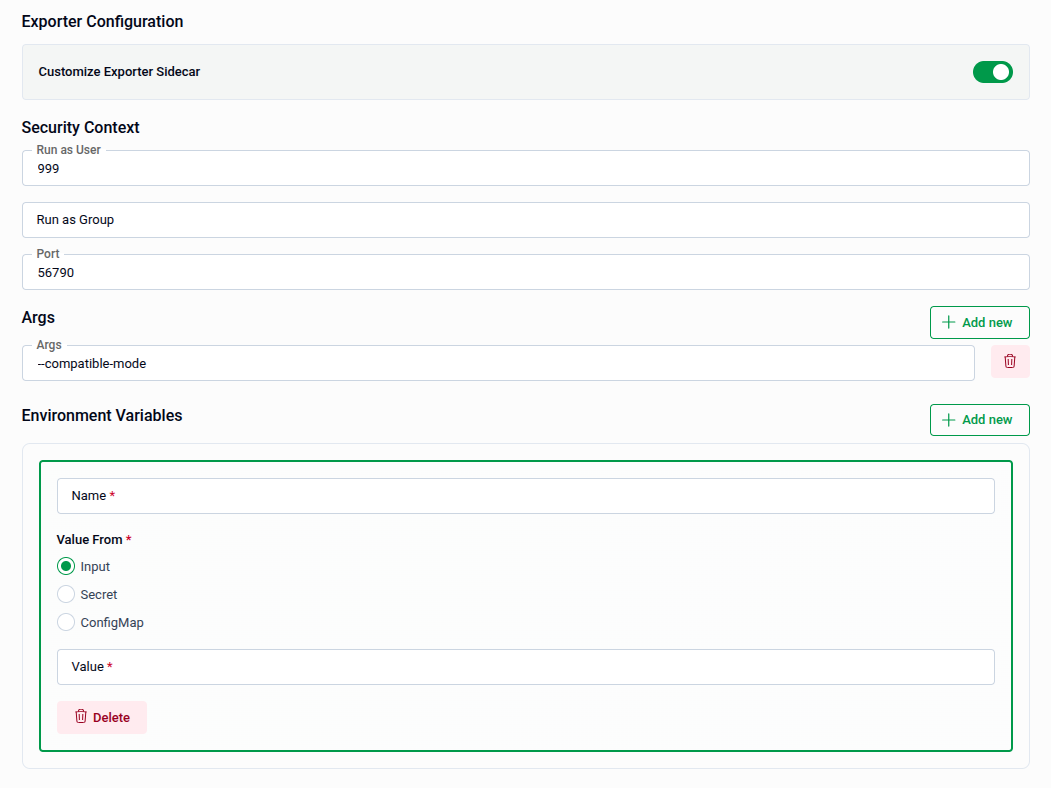
4.1 - Security Context
| Field | Description |
|---|---|
| Run as User | UID the exporter container runs as (e.g., 999). |
| Run as Group | GID the exporter container runs as. |
| Port | The port the exporter listens on (e.g., 56790). |
4.2 - Args
Use the Args section to pass additional command-line arguments to the exporter binary. Click + Add new to add an argument (e.g., --compatible-mode). Use the delete icon next to an entry to remove it.
4.3 - Environment Variables
Use the Environment Variables section to inject environment variables into the exporter sidecar. Click + Add new to add a variable. Each entry requires:
- Name — The environment variable name (required).
- Value From — The source of the value. Three options are available:
Input — Provide the value directly in the Value field.
Secret — Pull the value from a Kubernetes Secret:
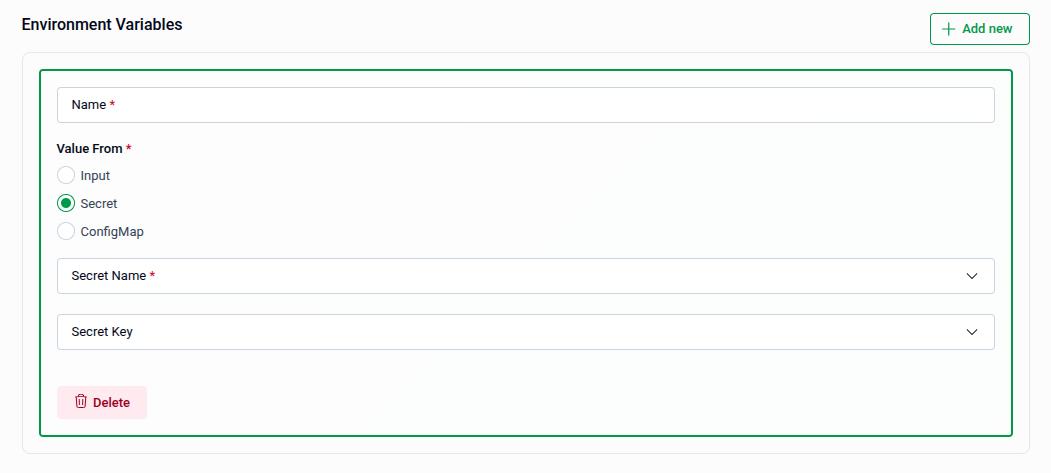
| Field | Description |
|---|---|
| Secret Name | The name of the Kubernetes Secret to read from (required). |
| Secret Key | The key within the Secret whose value will be used. |
ConfigMap — Pull the value from a Kubernetes ConfigMap:
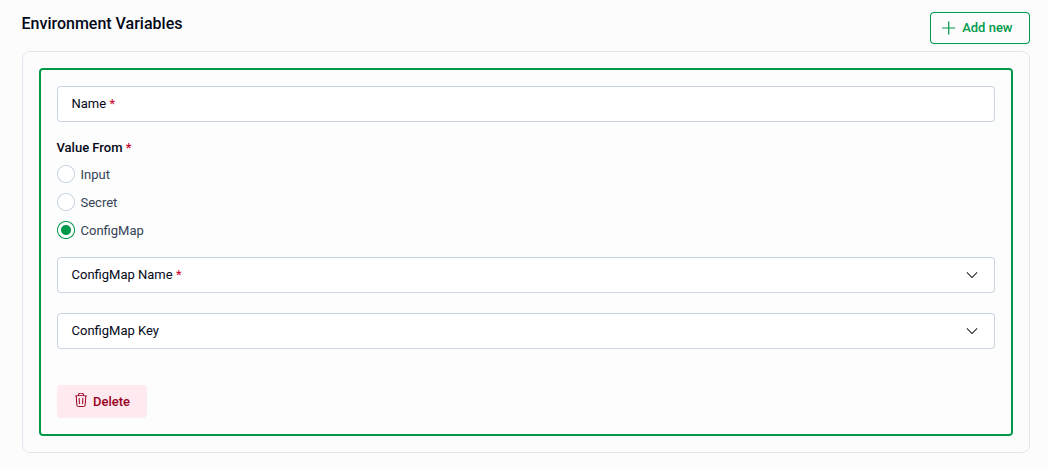
| Field | Description |
|---|---|
| ConfigMap Name | The name of the Kubernetes ConfigMap to read from (required). |
| ConfigMap Key | The key within the ConfigMap whose value will be used. |
Use the Delete button at the bottom of an environment variable entry to remove it.
5. Review and Submit
Once all sections are configured, click Preview to review the generated manifest before applying it if preview is enabled. Then:
- The manifest is shown in YAML view by default. Use the JSON button to switch to JSON format if preferred.
- Use the Copy button to copy the manifest to your clipboard.
- Click Previous to go back and adjust your settings if needed.
Tip: You can directly edit the YAML or JSON on the Preview page before submitting. This is useful for making precise adjustments beyond what the form fields expose.
- Submit: Once satisfied, click Submit to apply the monitoring configuration to your database.
Note: After submitting, the monitoring configuration will be applied to your cluster. You can verify the created
ServiceMonitoror annotations from the Monitoring section in the sidebar.
Quick Reference
| Action | How to do it |
|---|---|
| Enable monitoring | Toggle Enable Monitoring to on |
| Use Prometheus Operator | Select Prometheus Operator → set Scrapping Interval → Preview → Submit |
| Use a custom ServiceMonitor | Select Custom ServiceMonitor → configure Endpoints and Labels → Preview → Submit |
| Use annotation-based scraping | Select Custom Scrapper → Preview → Submit |
| Customize the exporter sidecar | Toggle Customize Exporter Sidecar → configure Security Context, Args, and Environment Variables |
| Add an env var from a Secret | Environment Variables → + Add new → select Secret → provide Secret Name and Key |
| Add an env var from a ConfigMap | Environment Variables → + Add new → select ConfigMap → provide ConfigMap Name and Key |
| Edit manifest before applying | Use the YAML / JSON toggle on the Preview page |
| Apply the monitoring config | Click Submit on the Preview page |