


Database Usage & Insights
This guide explains how to use the Overview, Insights, and Users pages available on every database detail page in the AppsCode console. These pages give you a live view of your database's connection details, performance metrics, query analytics, and access control bindings.
1. Getting Started
From the Datastore section in the left sidebar, click on any database engine (e.g., MongoDB) and then click on a database instance name to open its detail page. The top of the page shows three main tabs:
- Overview — Connection details and a high-level insights summary.
- Insights — Detailed metrics, Grafana dashboards, slow queries, and top collections.
- Users — Root user credentials, AppBindings, and KubeVault-managed access.
2. Overview
The Overview tab is the landing page for any database instance. It is divided into two panels — Connection Details and Insights — and a Nodes table at the bottom.
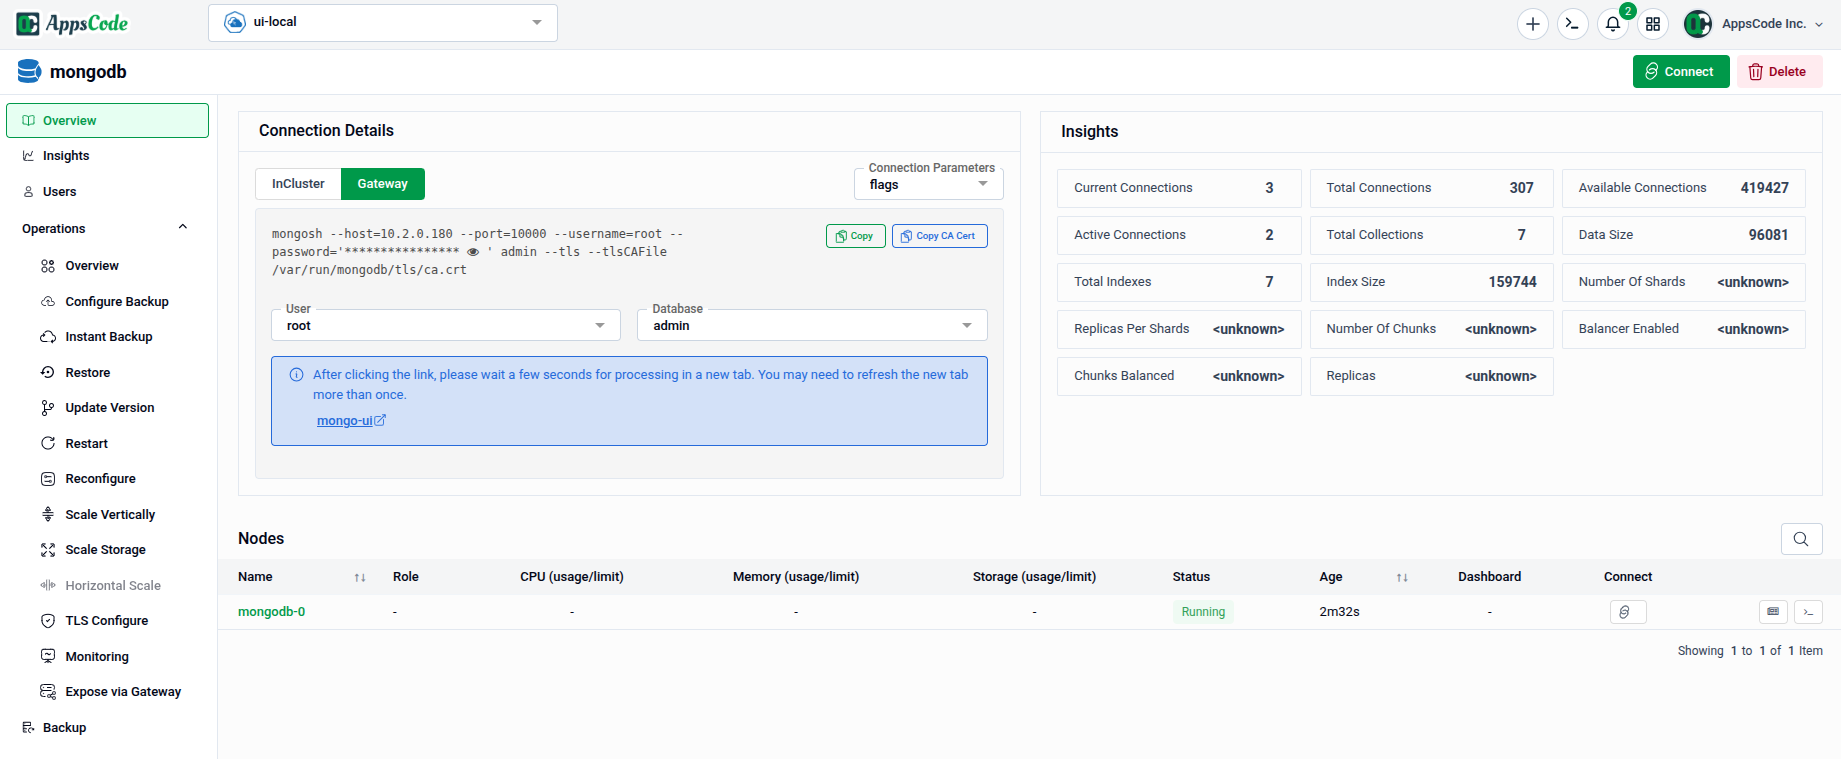
2.1 - Connection Details
The Connection Details panel provides everything needed to connect to the database:
- Basic tab — Shows the primary connection string and quick-copy flags for connecting with the CLI or client libraries.
- Connection Parameters tab — Breaks down individual connection parameters (host, port, username, database name) so you can assemble a custom connection string.
Note: After clicking the link, please wait a few moments for it to process. You may need to refresh the page to see the updated data.
2.2 - Insights Summary
The Insights panel on the right gives a live snapshot of key database statistics:
| Metric | Description |
|---|---|
| Current Connections | Number of active client connections at this moment |
| Total Connections | Cumulative connections since the database started |
| Available Connections | Remaining connections before the limit is reached |
| Active Connections | Connections currently executing an operation |
| Total Indexes | Total number of indexes across all collections |
| Index Size | Total disk space used by all indexes |
| Total Collections | Total number of collections in the database |
| Data Size | Total size of all documents stored |
| Replicas Per Shards | Number of replicas in each shard |
| Number Of Shards | Total number of shards in the cluster |
| Number Of Chunks | Total number of chunks across all shards |
| Chunks Balanced | Whether chunks are evenly distributed across shards |
2.3 - Nodes
The Nodes table at the bottom lists every pod in the database cluster with its role, CPU and memory usage, storage, status, age, and links to its dashboard and connect shell.
3. Insights
The Insights tab provides a deeper view into database performance — including Grafana dashboards, slow query analysis, and collection-level storage metrics.
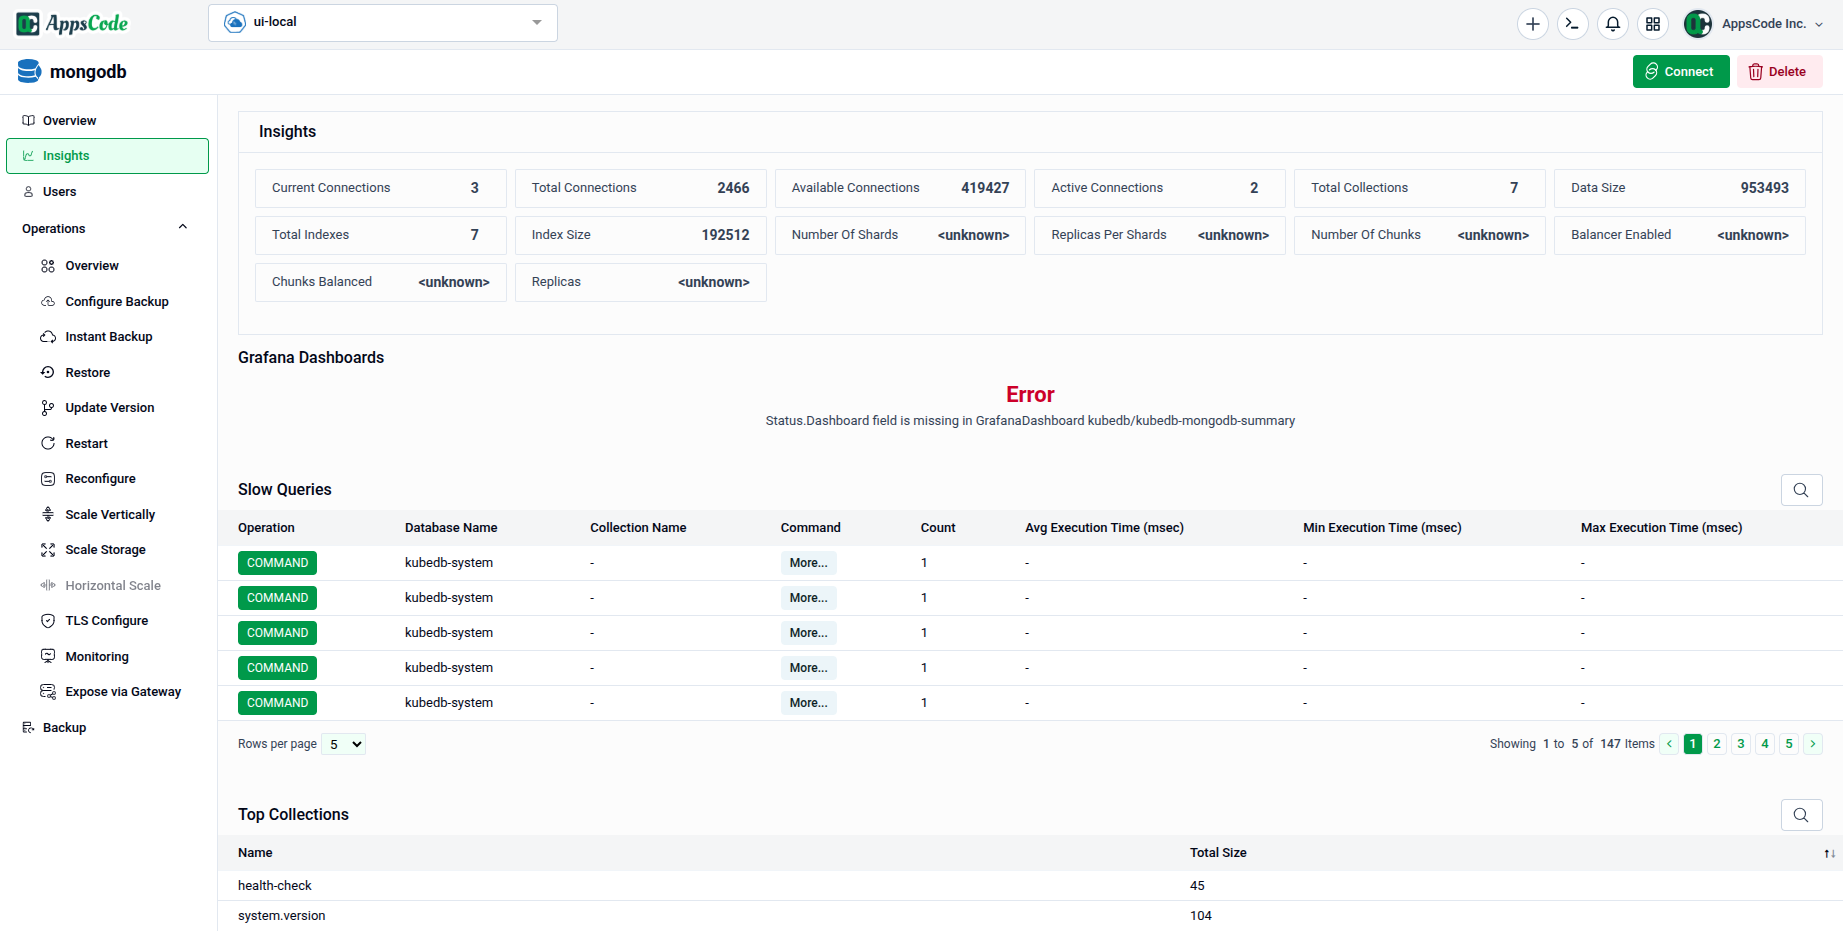
3.1 - Insights Summary Row
A condensed stat row at the top mirrors the key metrics from the Overview panel for quick reference without switching tabs.
3.2 - Grafana Dashboards
The Grafana Dashboards section embeds pre-built dashboards for your database directly in the console. If Grafana integration is not yet configured, an error message will indicate that the dashboard link is missing and provide instructions to set it up.
Tip: To enable Grafana dashboards, ensure the Grafana datasource is configured in your cluster and the correct dashboard URL is registered in your AppsCode settings.
3.3 - Slow Queries
The Slow Queries table lists database operations that exceeded a performance threshold. Each row contains:
| Column | Description |
|---|---|
| Operation | The type of database operation (e.g., find, update) |
| Database Name | The database where the slow query ran |
| Collection Name | The collection targeted by the query |
| Command | The raw command document |
| Count | How many times this query pattern was recorded |
| Avg Execution Time (ms) | Average time the query took to execute |
| Min Execution Time (ms) | Fastest recorded execution for this query pattern |
| Max Execution Time (ms) | Slowest recorded execution for this query pattern |
Use the pagination controls at the bottom-right to navigate through results.
3.4 - Top Collections
The Top Collections table lists collections ranked by total storage size, helping you identify which collections consume the most disk space.
| Column | Description |
|---|---|
| Name | The fully qualified collection name (e.g., health.check) |
| Total Size | Combined size of documents and indexes in the collection |
4. Users
The Users tab shows all access credentials, bindings, and KubeVault-managed secrets associated with the database instance.
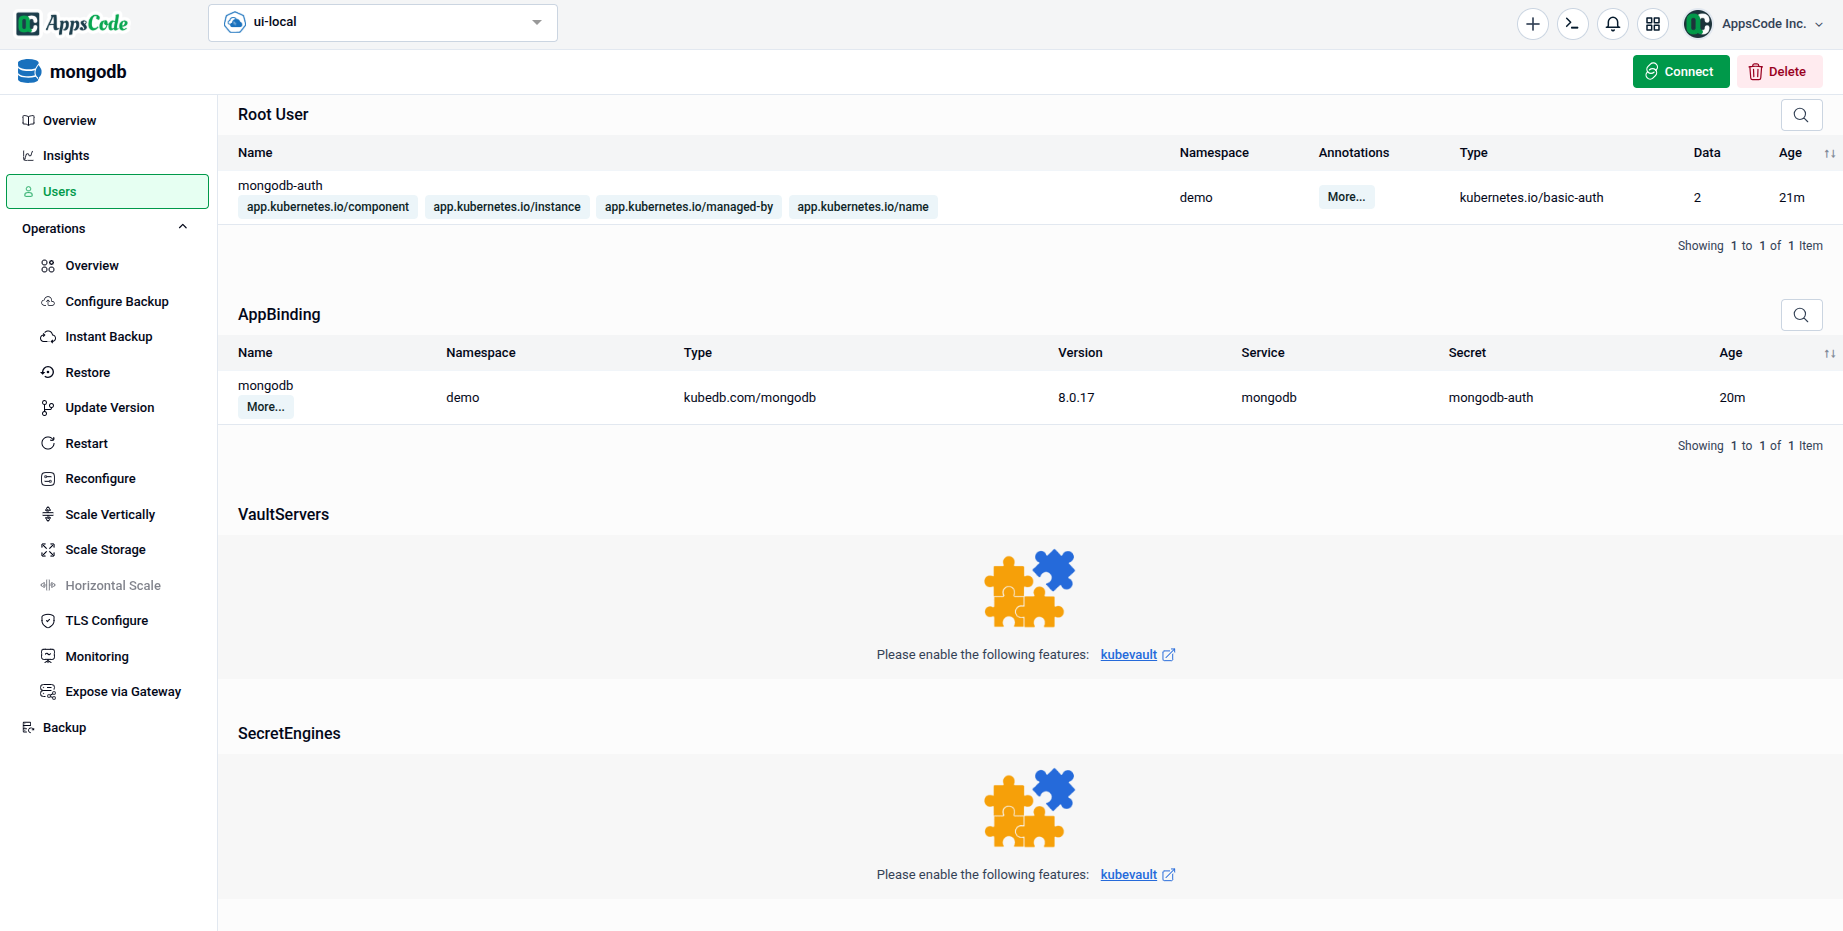
4.1 - Root User
The Root User section lists the primary database credentials created by KubeDB. Each entry shows:
| Column | Description |
|---|---|
| Name | The Kubernetes Secret name holding the credentials |
| Namespace | The namespace where the Secret resides |
| Annotations | Key annotations applied to the Secret (e.g., managed-by, instance) |
| Type | The Secret type (e.g., kubernetes.io/basic-auth) |
| Date | Creation date of the Secret |
| Age | Age of the Secret |
4.2 - AppBinding
The AppBinding section lists AppBinding resources that expose this database to other applications in the cluster. Each entry shows:
| Column | Description |
|---|---|
| Name | The AppBinding resource name |
| Namespace | The namespace where the AppBinding resides |
| Type | The AppBinding type (e.g., kubedb.com/mongodb) |
| Version | The database engine version |
| Genres | The genre classification of the binding |
| Secret | The Secret referenced by this AppBinding for credentials |
| Age | Age of the AppBinding resource |
4.3 - VaultServers, SecretEngines, MongoDBRoles & SecretAccessRequests
The lower sections of the Users tab are powered by KubeVault and provide dynamic secret management for your database.
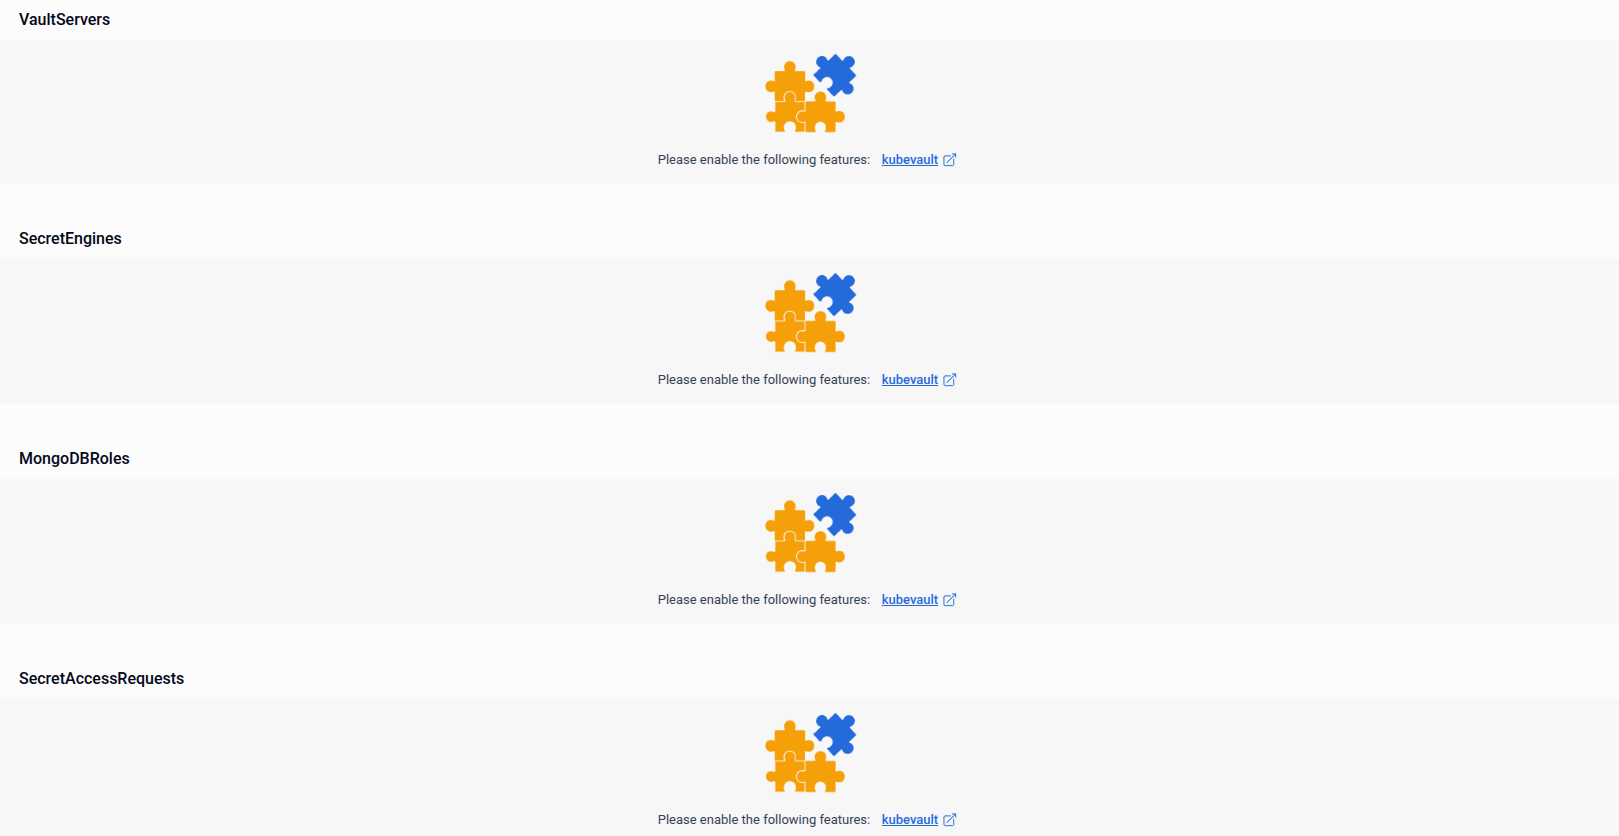
| Section | Description |
|---|---|
| VaultServers | Lists Vault server instances managing secrets for this database |
| SecretEngines | Lists configured secret engines that generate dynamic database credentials |
| MongoDBRoles | Lists KubeVault roles that define credential policies for this database |
| SecretAccessRequests | Lists requests made by applications for dynamic credentials |
Note: These sections require the kubevault feature to be enabled in your cluster. If not yet enabled, each section will show a prompt with a link to enable the feature.
Quick Reference
| Action | Where to find it |
|---|---|
| Get the database connection string | Overview → Connection Details → Basic tab |
| View live connection and storage stats | Overview → Insights panel |
| Check pod-level resource usage | Overview → Nodes table |
| View Grafana performance dashboards | Insights → Grafana Dashboards |
| Identify slow queries | Insights → Slow Queries table |
| Find largest collections | Insights → Top Collections table |
| Access root credentials | Users → Root User |
| View AppBindings for this database | Users → AppBinding |
| Manage dynamic secrets via KubeVault | Users → VaultServers / SecretEngines / MongoDBRoles / SecretAccessRequests |